A Kalshi Profit Tracker That Shows Where the Numbers Come From
Damage Report is an iPhone and iPad app for understanding your Kalshi performance. It turns your Kalshi history into realized and unrealized P&L, fees, positions, and funding activity, and lets you follow every total back to the trades behind it.
What it tracks.
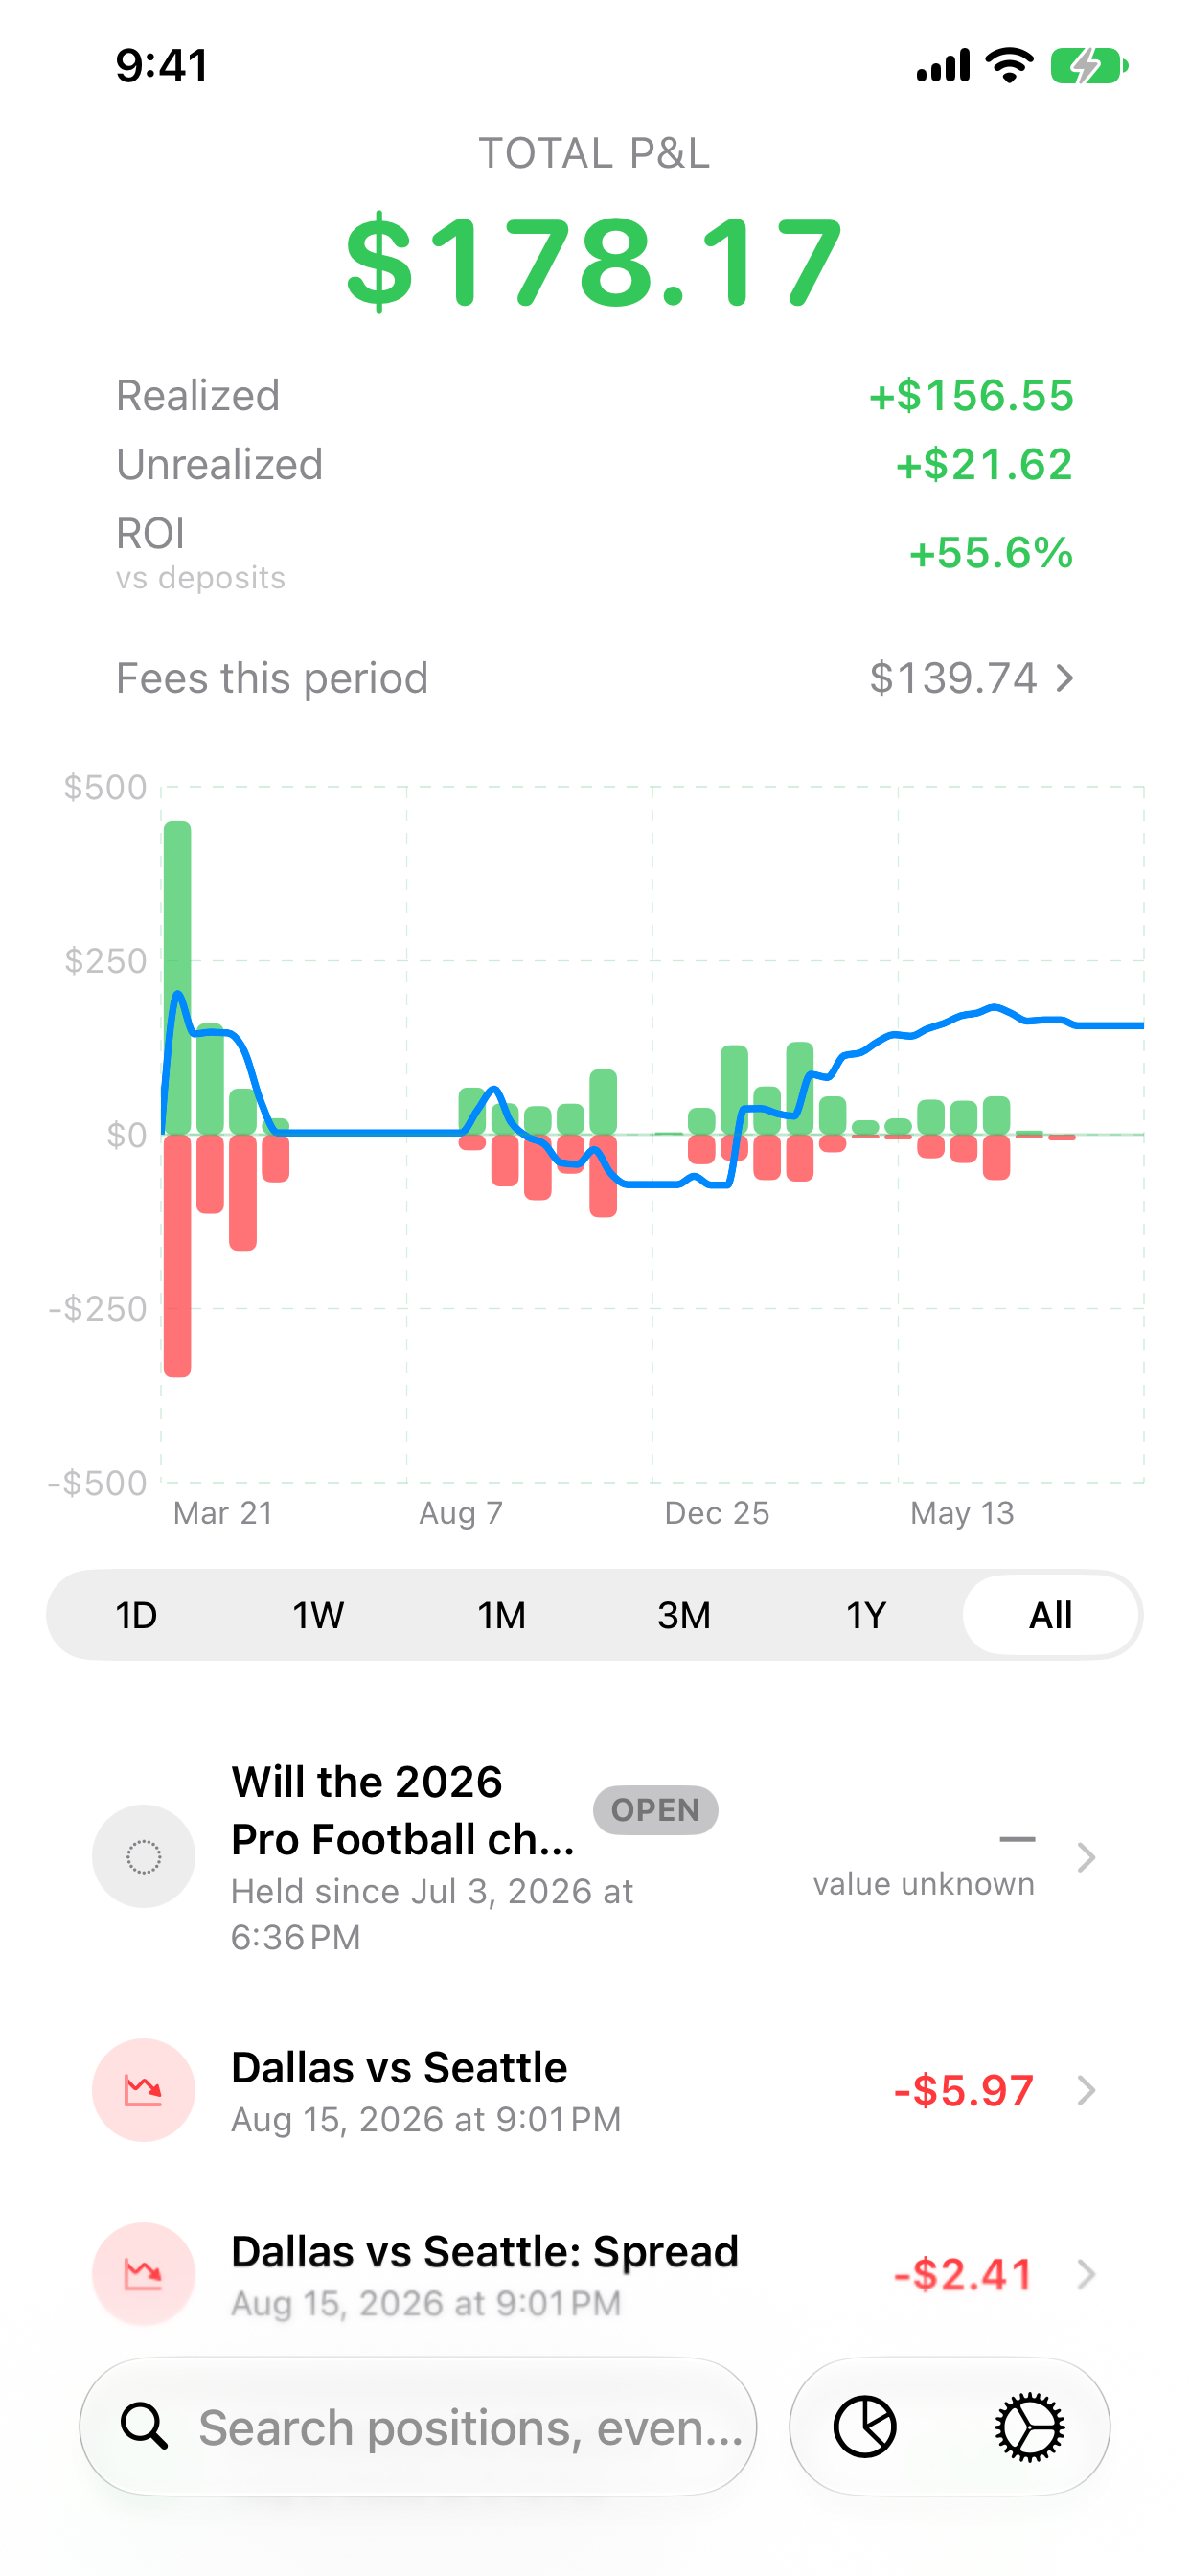
- Combined, realized, and unrealized P&L, with a range-aware return and an equity-style chart of performance over time.
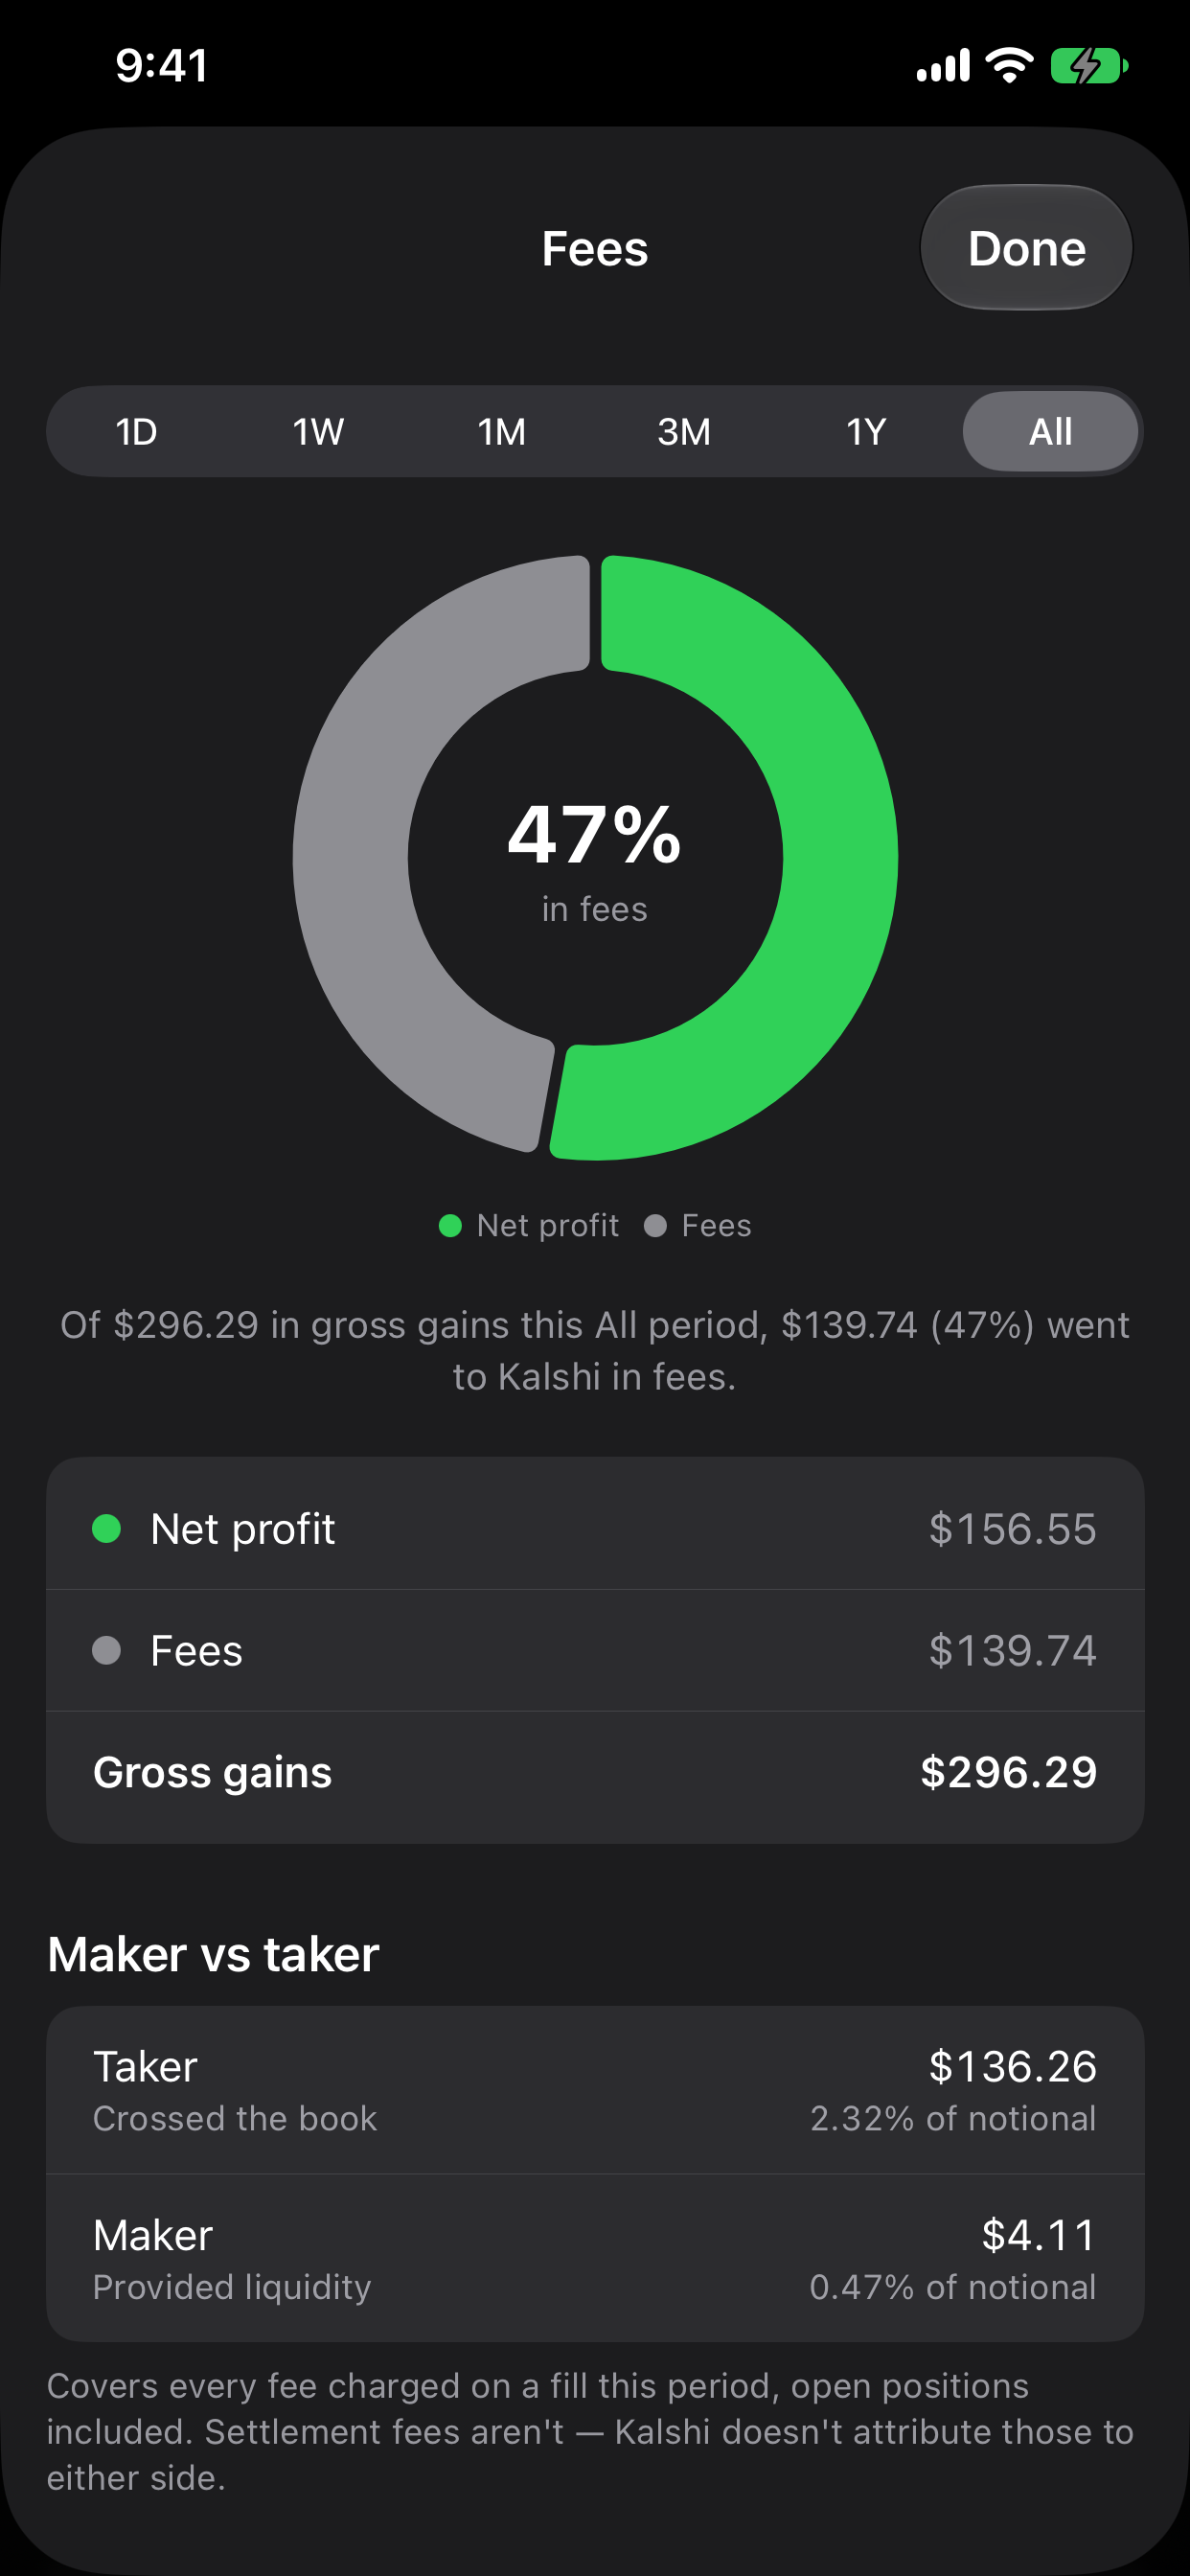
- Fees for the selected period, broken down by market, by maker and taker activity, and compared with net results.
- Positions, open and settled, searchable, each expandable to the fills and settlements that produced its result.
- Funding: deposits, withdrawals, and supported statement credits such as promotional credits, interest, and fee refunds, kept separate from trading P&L.
- Reconciliation checks that flag gaps and stale data, so you know when a total needs a closer look.
- CSV exports of fills and settlements when you need your records elsewhere.
Why a Kalshi P&L needs reconciliation.
Kalshi shows your cash, positions, and portfolio value, and offers a monthly-updated yearly P&L statement. Those figures mix or separate funding, open positions, credits, and fees in different ways, and they update at different times. Why your Kalshi numbers don’t match explains the usual causes. Damage Report puts the pieces side by side and connects each total to the records behind it.
Realized and unrealized, kept apart.
Realized P&L covers sales and settlements, net of the purchase cost and recognized fees. Unrealized P&L covers open positions at their current value, and is labeled unknown when a market value is missing rather than guessed. On the All range you see lifetime realized results combined with current unrealized results; shorter ranges show realized results for that period, with unrealized listed separately. Realized vs. unrealized P&L, explained.
Fees in context.
Fees are already included in P&L; the Fees view explains them, so you don’t subtract them twice. Drill into fees by market, by maker and taker activity, and by period.
Your history, record by record.
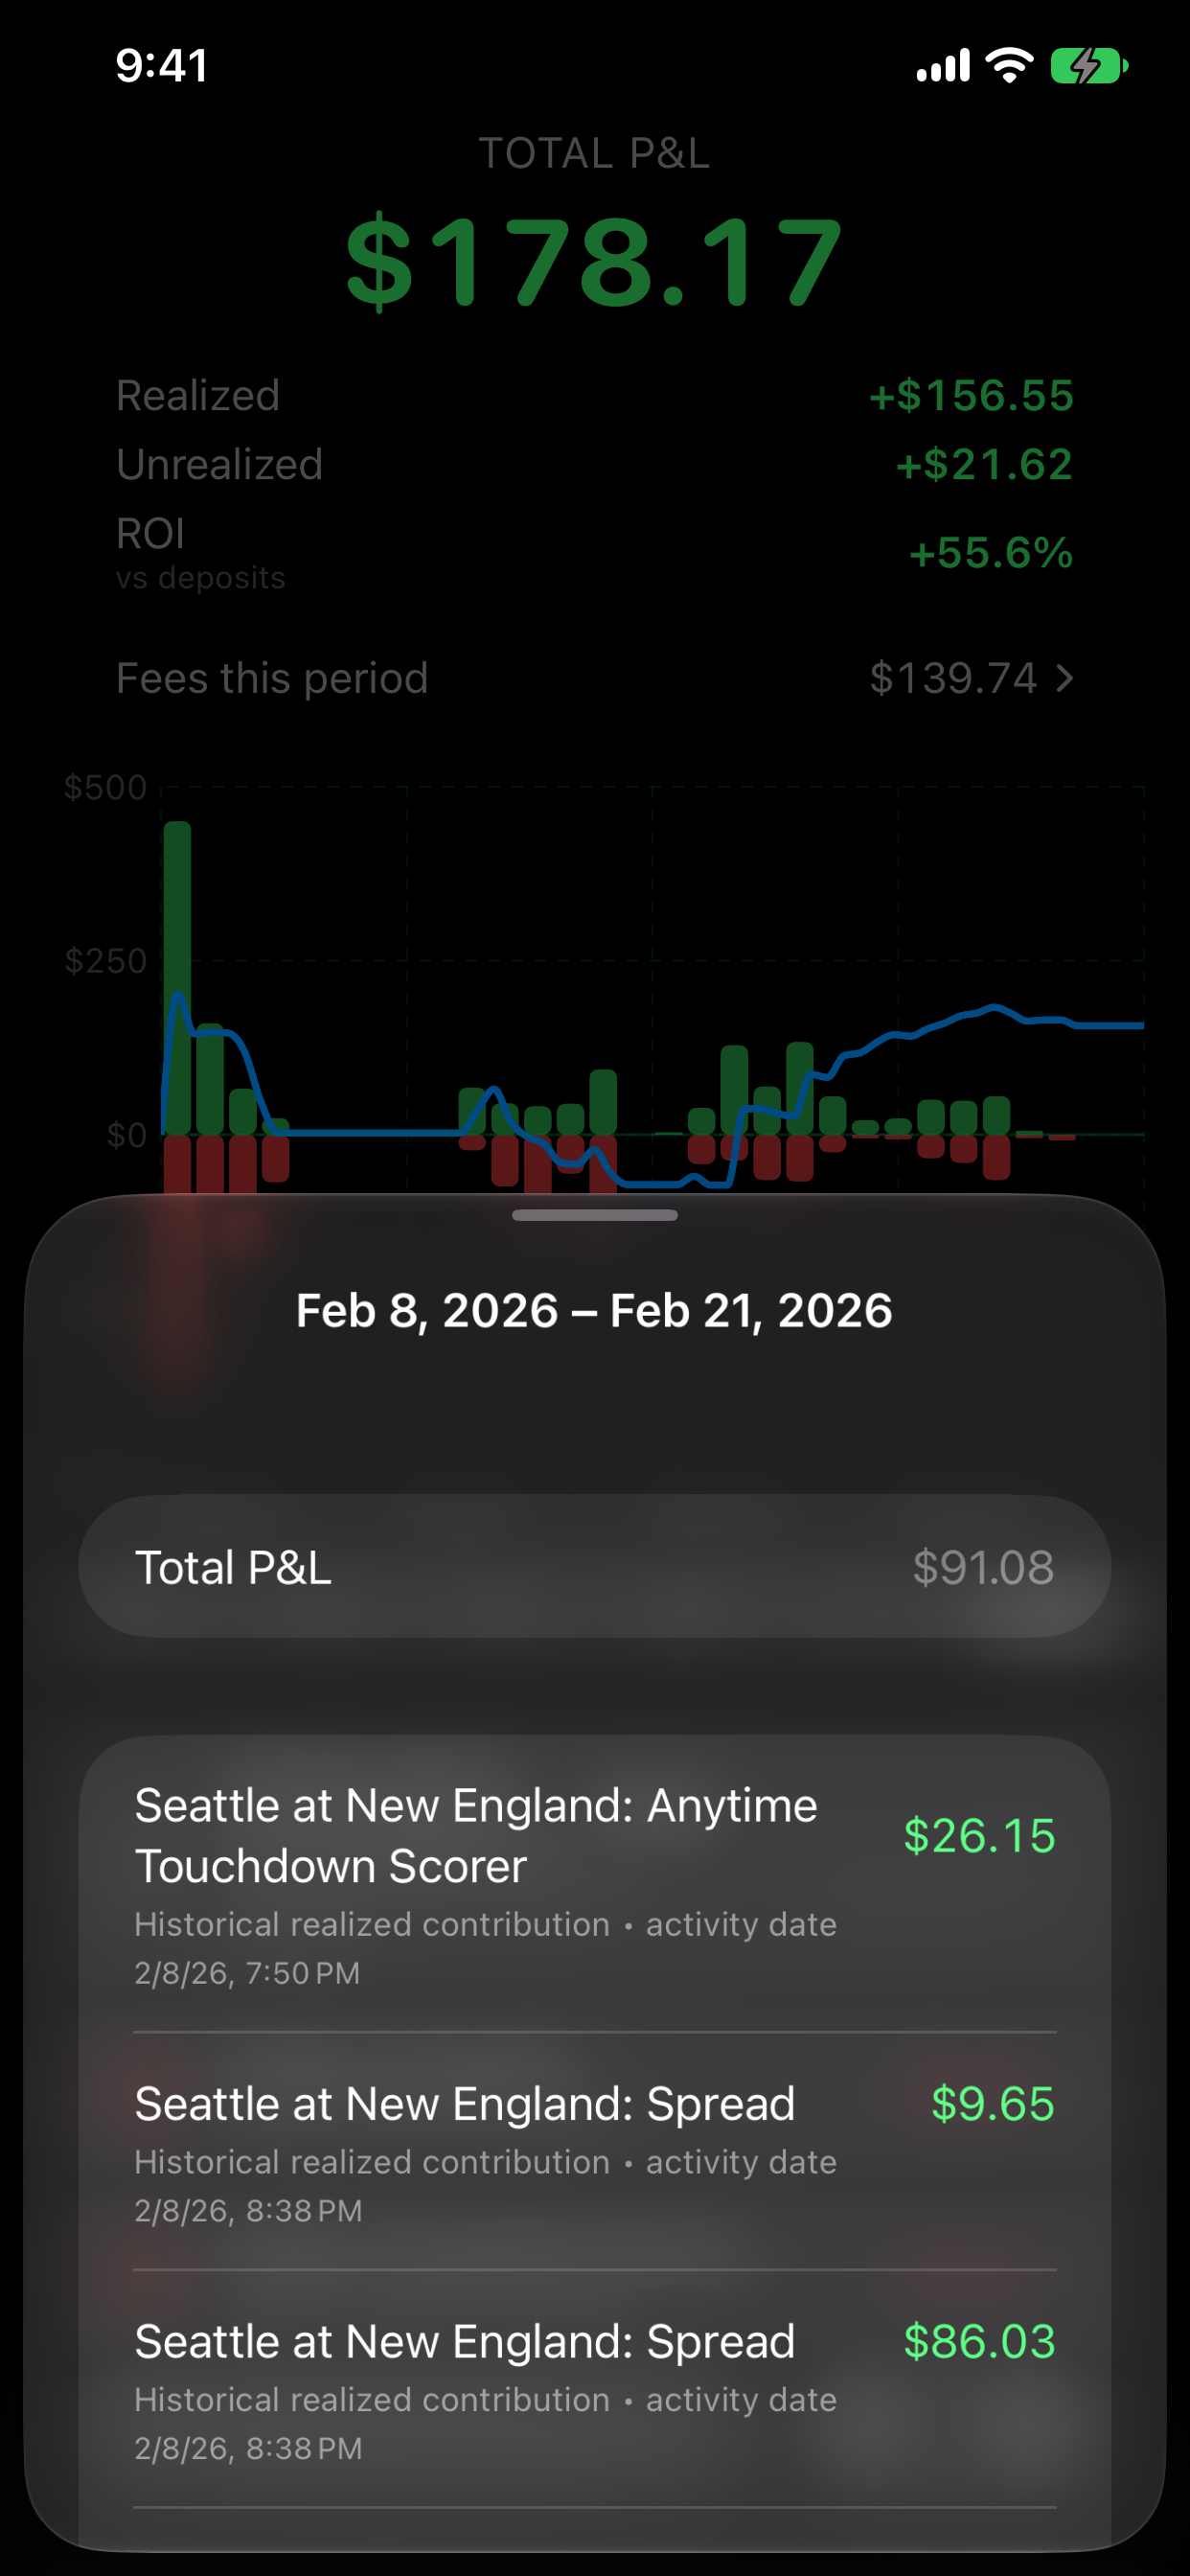
Tap a chart period to see the markets that moved it. Expand a position to see its fills and settlements, and open any record for its details. If something looks off, Resync History re-reads your full available history, and the P&L Diagnostic in Settings helps you investigate.
Private and read-only.
Damage Report connects directly to Kalshi with a read-only API key. The key file and key ID are stored in the iOS Keychain on your device, your account data is processed and stored locally, and Every Bit Works does not operate a server that receives it. The app does not place trades, withdraw funds, or otherwise transact on your account. How the Kalshi API connection works · Privacy policy.
What you need.
- An iPhone with iOS 26 or later, or an iPad with iPadOS 26 or later
- A Kalshi account and a read-only API key to see your own history
- Internet access to connect and sync
To look around first, demo mode shows curated example data without a Kalshi account. Damage Report is independent and is not affiliated with, endorsed by, or sponsored by Kalshi. It is a reporting tool, not financial or tax advice; verify results against your official Kalshi records.